
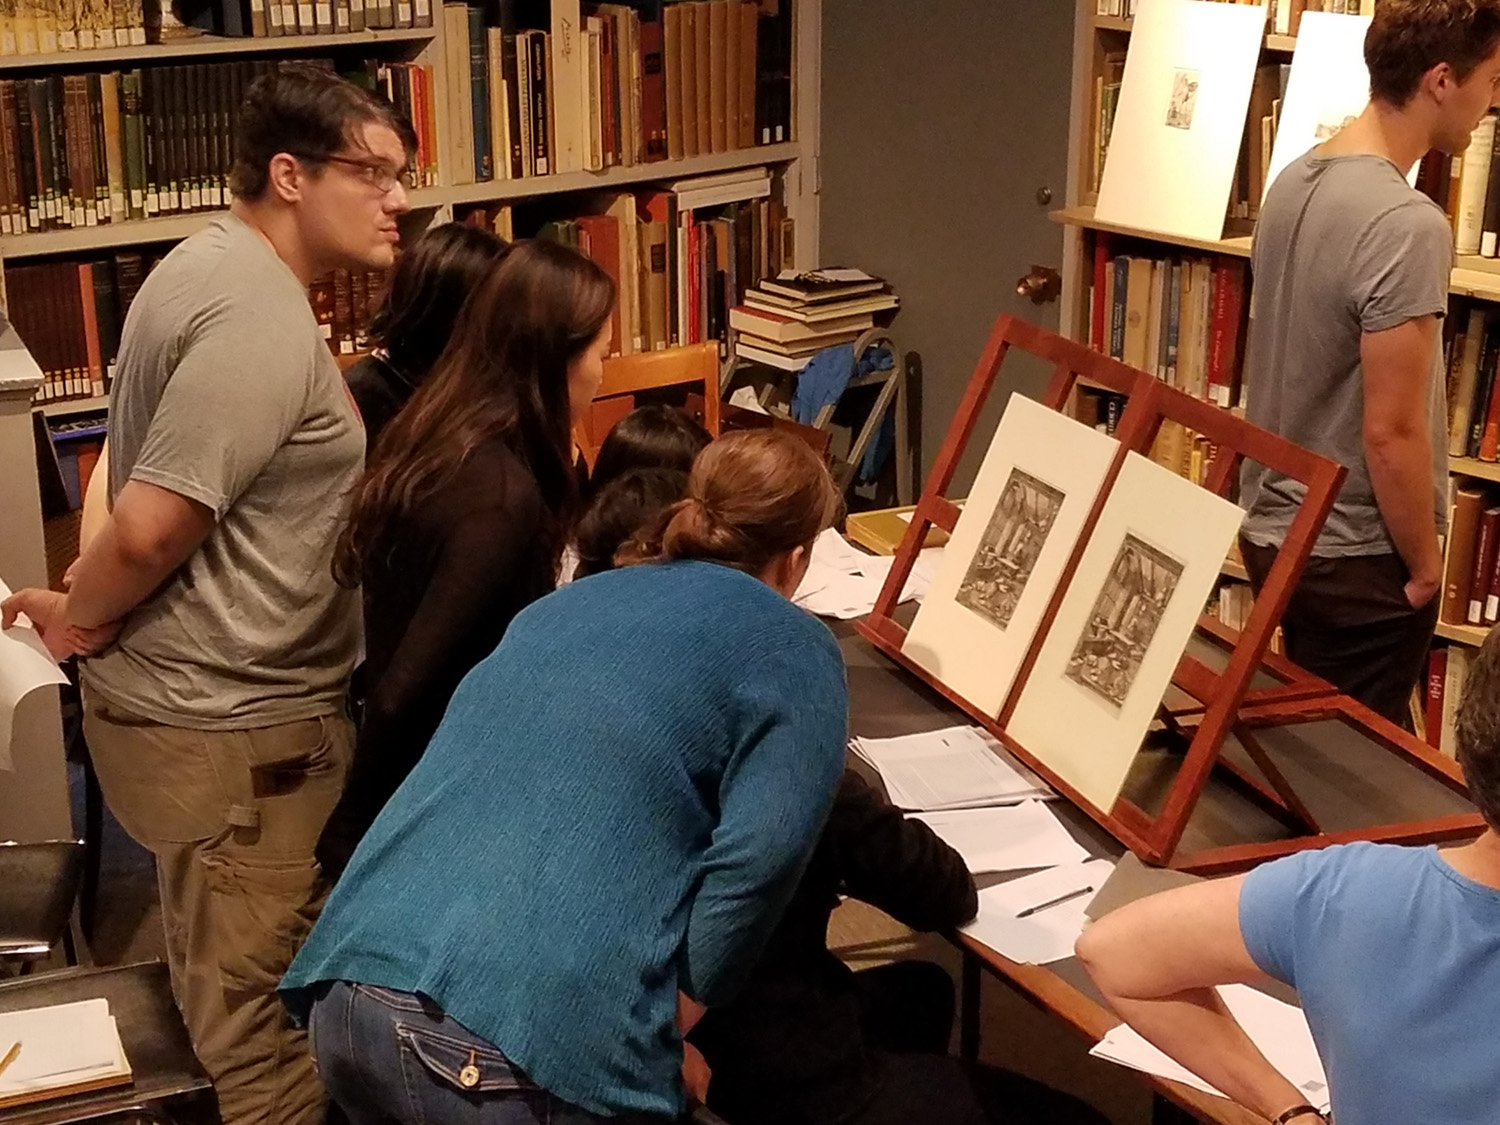
Many know that Wesleyan has a very large collection of prints dating back to the 15th century, stored in the Davison Art Center (DAC). Not many are aware that, through the efforts of the DAC staff, the collection comes with an extensive dataset containing metadata for all records. In the fall of 2017, students from the Introduction to Network Analysis (QAC 241) got a chance to view some of the famous prints and then search for new insights in art history using their quantitative skills. This post describes the experiences, accomplishments, and challenges of working with art history data.
For me, the first exposure to networks in prints came from the PhD thesis by Matthew Lincoln (link) on networks between artists, engravers, and printers in the Netherlands in the 17th century. (The process back then was that an artist would make a drawing on paper, this drawing would then be given to an engraver/cutter who would, depending on available technology, make either a woodblock cut, an engraving, or an etching out of it, and then a printer would run the press and make the prints.) Lincoln showed how the networks changed after the opening up of the trade with England. He used records from the British Museum in London and Rijksmuseum in Amsterdam, available via API requests. (API stands for Application Programming Interface and it allows users to submit web queries in standardized format and receive well-formatted data.)
When, in February 2016, DAC held an exhibit and a series of lectures focused on the woodcuts of Albrecht Durer (Passion and Power: German Prints in the Age of Durer), my mind was set. The history of woodblocks, the prints made from them, and their paths of ownership (the formal term is provenance) was fascinating: there were family-owned crypts in Europe used to protect the woodblocks from the elements, limited reprint runs made in the 19th century, never to be repeated again, the mysterious world of collectors, and the amazing feeling of connection to the past. And the data was here, in the DAC holdings. Ever since then, I wanted to introduce the topic in a QAC course and give students an opportunity to appreciate the richness of resources available at Wesleyan. (Another motivation was that Digital Humanities is a growing field in academia and many students would need the skills in the future. To take Matthew Lincoln, after finishing his PhD at the University of Maryland, College Park, he now works at The Getty Research Institute in Los Angeles.)
With the assistance of DAC curator Clare Rogan and DAC manager of museum information services Rob Lancefield, this intention became a reality in the fall of 2017. Clare Rogan set aside time for the class visit, and Rob Lancefield generated a large XML file containing metadata on nearly 5,000 items in the DAC collections. (To keep the file size down, we agreed to focus only on the items that have been digitized and whose images can be viewed online.)

As part of the course, students also learned how to work with Union List of Artist Names available as an API from the Getty Institute and querying ULAN data via SPARQL – a version of SQL for linked data.
As an illustration, below is the screenshot of data on associations of Albrecht Durer generated by ULAN (to check out the full page, click here)
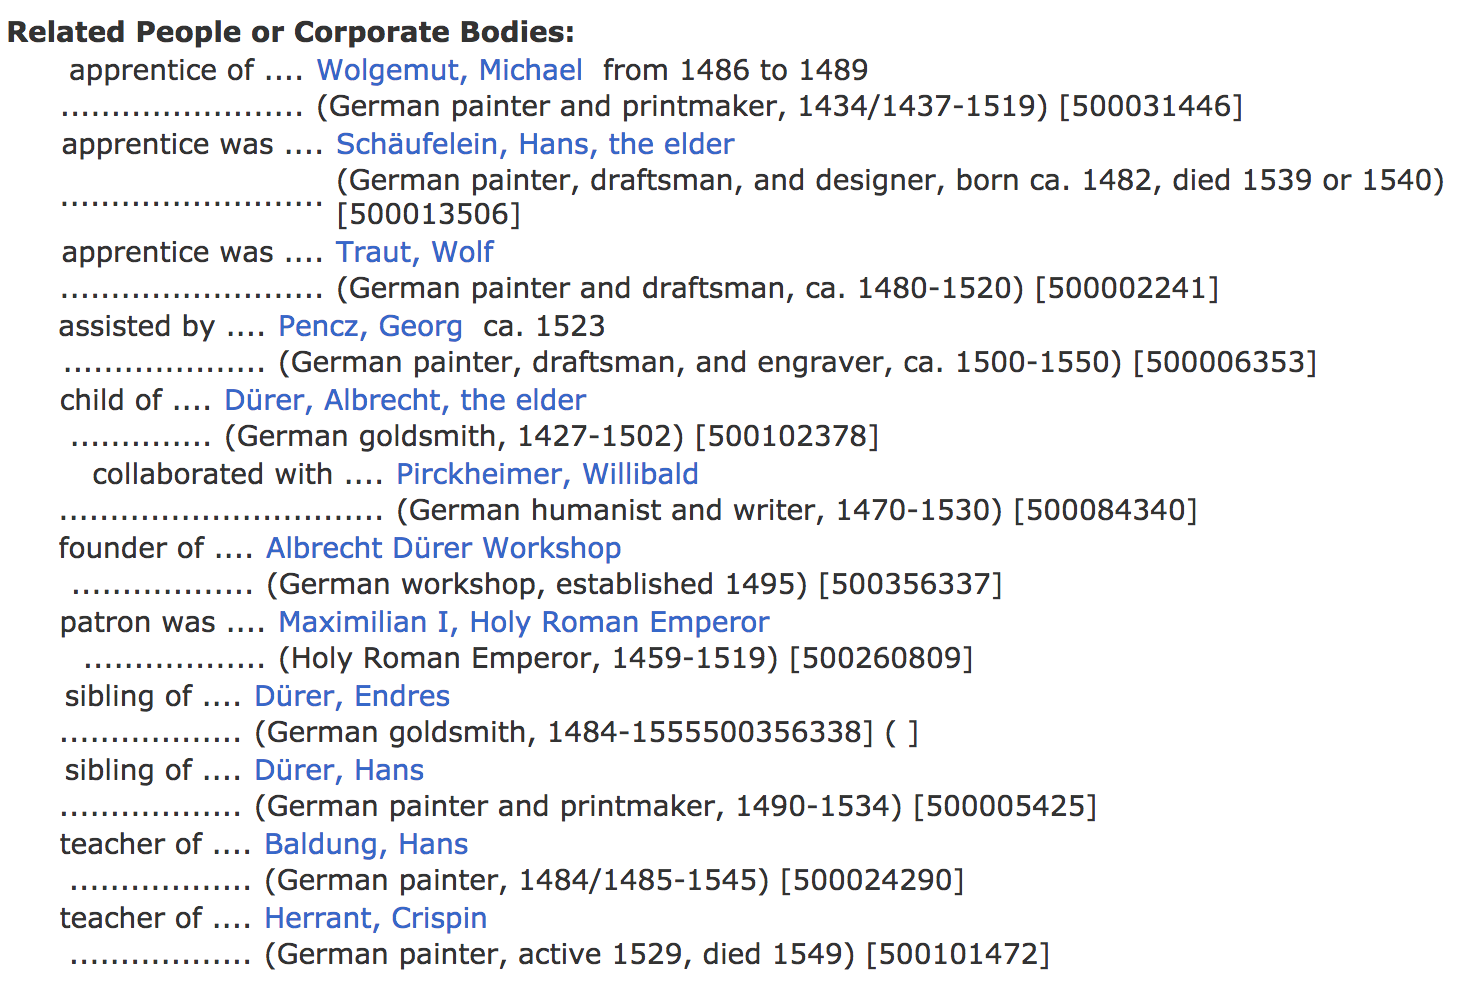
ULAN data made it possible to construct networks describing relations between people: teacher-student, patron-artist, co-workers, and geographic movements. The networks of provenance could be constructed only from the DAC data: the records contain information on the so-called Lugt numbers, which can be linked to owners. The Lugt numbers deserve some explanation. It used to be that owners would stamp a personal logo on a piece of art they bought. Frits Lugt, a Dutch scholar, has spent several decades of his life cataloging these logos: the first volume of his work was published in 1921, the second – in 1956, with new updates added even now by researchers at the Fondation Custodia / Collection Frits Lugt in Paris. (Thanks to Dr. Peter Fuhring for sharing this information.) You can experiment with an online version (in French) at http://www.marquesdecollections.fr/
For example, the 15th century engraving by Martin Schongauer, the teacher of Durer, Christ before Pilate (link) has the most Lugt numbers among DAC items: six. There is Lugt 2529 that belonged to Karl Ferdinand Friedrich von Nagler (1770-1846), a Bavarian diplomat, Lugt 1606 and Lugt 2398, both associated with the Cabinet of Prints of State Museums in Berlin, founded in 1831, Lugt 2270 that belonged to Emil Schroeter, a collector from Dresden who died in 1912, Lugt 499, associated with Charles B. Eddy (born 1872), a lawyer in Plainfield, New Jersey, and finally Lugt 2091 that belonged to P.J. Sachs, deputy director of Fogg Art Museum at Harvard University.
If you like tracking provenance, here are links to several prints with four Lugt marks: Albrecht Durer, The Standard Bearer, circa 1502, Marco Dente, Venus, circa 1516, Hendrik Verschuring, Man and Woman on a Horse and Donkey, 17th century.
It is also possible to make networks of influences (or, to use pop culture terminology, of “remakes”). Many DAC records contain the “After …” field, indicating that the print is inspired by an earlier work of a different artist. For example, the Punishment of Niobe, visible in the photo above, shows the sculptural group (frieze) created by Polidoro da Caravaggio in Rome. Hendrik Goltzius traveled to Rome and made a set of eight drawings showing the frieze. After he brought them to Amsterdam, they were converted into etchings by another artist – Jan Saenredam, – and offered for sale as prints. That’s a pretty long chain of cultural influencers.
The topic of influencers also demonstrates the areas where digital methods still cannot go far without human involvement. Clare Rogan set up, side by side, the engraving by Albrecht Durer, Saint Jerome in His Study, made in 1514 (link), and an imitation done as a study by 13-year-old Hieronymus Wierix in 1566 (link), and asked the students to identify which work was the original. Students had a lot of fun being art detectives. The differences were in the execution of the strokes: Wierix was too focused on dutifully reproducing the lines, and as a result they were too uniform in thickness and failed to convey the shades the same way as was done by Durer.
Working with DAC data was not without its challenges. For one, the SPARQL technology offers a way to quickly retrieve data, but requires a lot of background knowledge. On a similar note, the variability of collections data presents its own difficulties. To illustrate this point, The Metropolitan Museum of Art in New York (The Met) also publishes its catalog online (link), but provides it in CSV (comma-separated values) format. CSV is a “flat” format that is easy to work with, but it does not support nested data. In order to fit its complex dataset into the “flat” structure, the Met discards some information: for example, the web pages for paintings list Lugt marks, but the CSV file does not. In contrast, the DAC does a better job (thank you, Rob L.): the catalog file does not discard anything, but in turn requires more care in processing it.
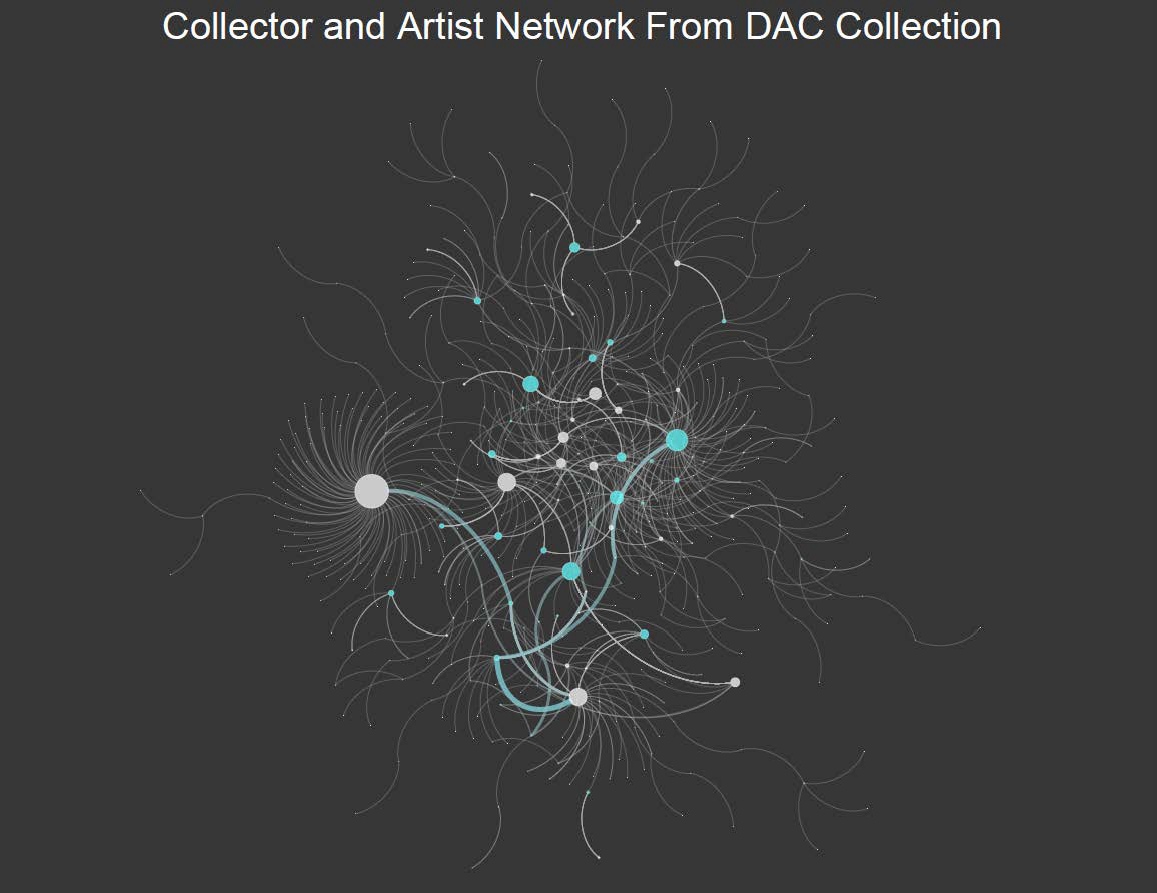
At the end of the course students were asked to do a mini-project: create a single image of a network conveying information about artists whose work is present in the DAC holdings. To make it easier, students worked in groups of two. The winner, determined by student votes, is the network below, created by Maya Harlan ’19 and Kayla O’Brien ’19:
Description of the network:
This network maps the connections between different collectors’ stamps and artists’ works in the DAC collection. Through the buying and selling of each piece, the artwork was passed from collector to collector, each imposing their own individual Lugt mark. Each artist node depicts an artist who has a piece of art within Wesleyan’s DAC. The edges are created by links of collectors that have had some artwork in the DAC created by a specific artist in their possession at some point in time. The thicker the edges, the more pieces of work from the specific artist the collector had their stamp on. For instance, Howard Mansfield, Lugt 1342, owned the most pieces by a single artist, James McNeill Whistler… The Lugt numbers are denoted by white nodes, while the blue nodes indicate different artists.
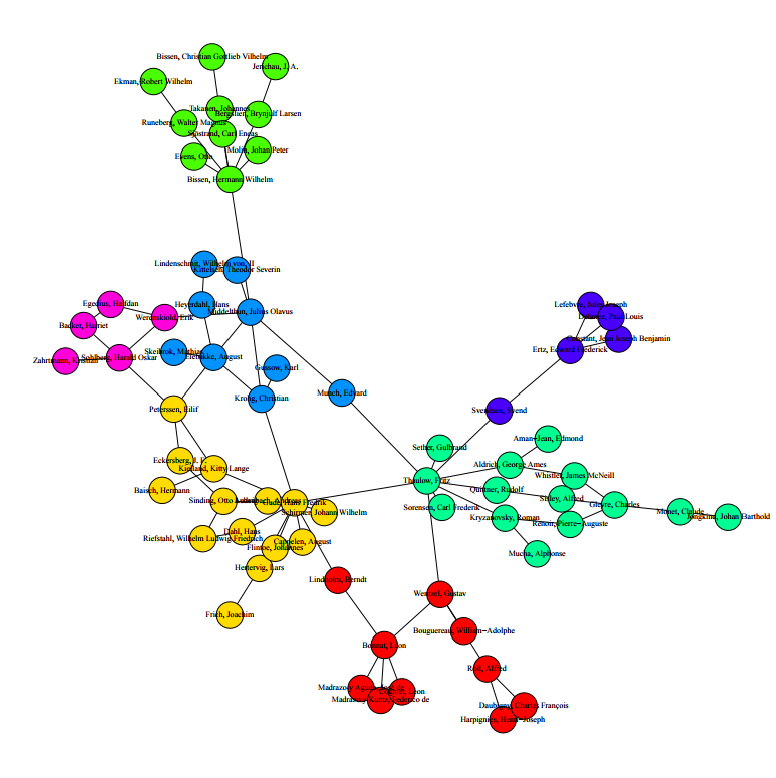
Winners of the second place were Zach Tan ’18 and Dennis White ’19 and they utilized Getty’s ULAN to retrieve data on artists whose work is represented at DAC – Edvard Munch of The Scream fame:
Network description:
Our network demonstrates the influences that came to fruition in Edvard Munch’s art. The two primary nodes that we identify as most directly influential are Fritz Thaulow and Julius Olavus Middelthun. … The green community represents a new wave of French Impressionist painters in the 19th century, with the red community representing French and German painters associated with realism and naturalism, while the purple community mainly represents some connection to America at one point or another in those artists’ life. From Middelthun’s node, we observe a more local connection to communities instead, with lime green representing nordic sculptors, magenta primarily being Norwegian painters, and yellow representing artist associated with the Düsseldorf school of painting (the light blue community that Middelthun is part of consists of artists based at one point or another in Christiania, which is now Oslo).
Overall, the collaboration with DAC was a great experience. Clare Rogan and Rob Lancefield went out of their way to help with the setup of the project. For almost everyone, this was the first experience of looking up close at the centuries-old prints. Students learned new technologies, which are applicable in other quantitative areas as well. A pleasant outcome was that the work produced by the QAC 241 students was on par with the projects done at the specialized Coding Durer International Hackathon for Art History, held in March 2017 in Munich, Germany. (The projects are described on this page).