
November 10th-12th saw the long awaited and oft rescheduled coding event, Data Dive, finally come to fruition. About twenty-two Wesleyan students gathered in the Exley fish bowl on Friday evening, and split into teams that tackled a multitude of questions related to gun data. After two days of work, the groups presented a fascinating combination of visualizations, analysis, and activism.
The participants explored a wide range of topics, from connections between gun sales and mass shootings, to location patterns of gun sales, to keywords that purchasers typically search for. As Wesleyan’s partner for this event, EveryTown, provided the volunteers with several extensive data sets. One of these was compiled from Armslist, an advertising site specifically allowing private sellers to market their guns to other individuals. While accessing the site requires confirmation that the individual is “18 years old, will follow all local, state and federal laws, and will not use Armslist for any illegal purposes,” Armslist itself does not ensure that buyers have a license or have completed a background check. This has led to the site being criticized by organizations like EveryTown on its lax approach to gun circulation.
Some students worked specifically with this data to see what keywords purchasers look for in the ad descriptions, as well as which locations around the country have the most listings. One group found the answers — the state of Ohio had the greatest number, and that the most used keywords were condition-related (eg/ “new”). Other groups also looked at the same data set, but instead focused on location to see if there was any significant pattern in which states used the site most often. One group hypothesized that the most active states were swing states – those that often go either republican or democratic in elections.
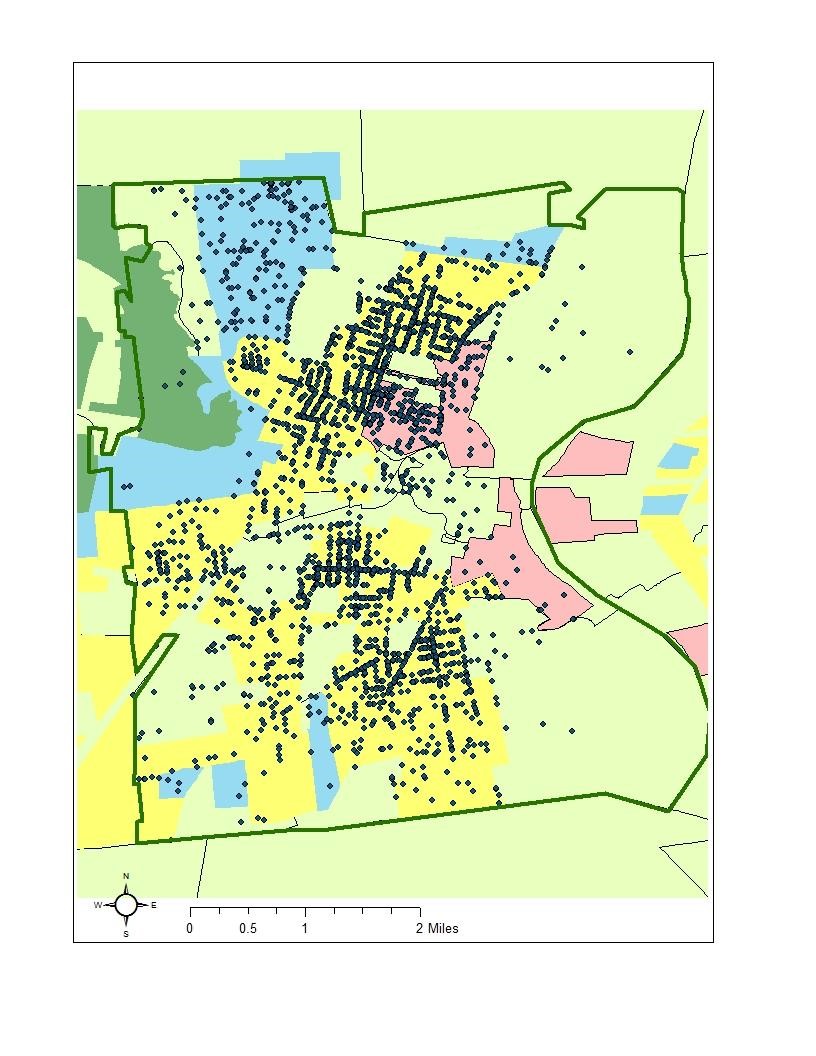
From its conception, a core purpose of DataDive is an activist pursuit – students volunteer their weekend and coding skills to pursue questions for the greater social good. This activism showed itself as many students addressed topics directly related to how sites like Armslist have been criticized for allowing un-facilitated sales of guns. One student looked at the city of Hartford and the ways that gun sales have been targeting “unsafe” neighborhoods. The student was provided with a dataset that covered all police incidences in Hartford, and details of what particular kind of gun was used for each documented instance of crime. From this data, the group connected the issue to redlining “In the 1930s, as part of the New Deal, FDR created loan programs to help Americans finance their homes,” Grace Wong ’18 explained in their group’s presentation. “But to decide who got those loans, the government created color-coded maps in which green neighborhoods were good and red neighborhoods were bad. This practice became known as redlining because of these policies if you lived in the green neighborhoods it was super easy to get a home loan by property but for folks in the red areas no loans were available.”
The students investigating redlining mapped the gun-related incidents reported in the dataset onto a map of Hartford that showed these zoning decisions. They discovered a correlation between the total number of incidents and rate of occurrences of redlining.
This approach of combining the data with the sociopolitical affects of a law brings up an important point. The topic of most discussions regarding gun control, and the reason sites like Armslist face so much criticism, is regulating gun ownership – or rather, the lack of adequate regulation. The results of this group show that there is a need for work like this to be done. However, the way the group connected its work to redlining, branching out its analysis to a social phenomenon unknown to many even at the final project presentations, shows that analyzing data isn’t always enough. There is still a need for bringing in a sociological lens, and allowing data analysis to work in tandem with other analyses of culture and politics.